Normal Distribution (A.K.A. the Bell Curve):
Skewed Right Distribution:
Skewed Left Distribution:
Graphs may follow a slight variation (for example, a graph may begin to follow a skewed right distribution but then start to have outliers). We usually analyze the overall shape the graph tends to follow.
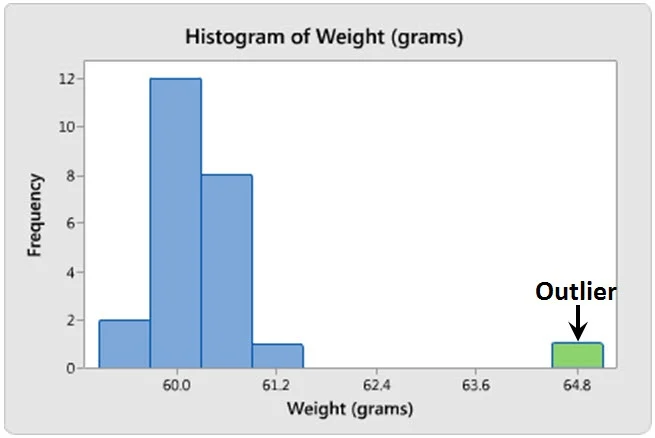
Outliers: data that does not align with the general pattern of distribution... this data is considered inconsistent.
Revisiting - Precise and Accurate data
Accurate: When data is accurate, the data collected is very close to the real value. However, the data does not have to be totally precise. For example, the measurement of mass in grams for the same item is always exactly or slightly off from the real measurement value. Comparing data to a reference point.
Precise: When data is precise, the data collected is very close to each other (constantly consistent). This does not necessarily mean, however, that the data is accurate. For example, measurements of mass in grams for the same item can vary, but remains precise when all measurement values are very close to each other (less variation). Comparing individual data to overall data.


No comments:
Post a Comment